
COURSE:
media:
Date:
media:
Date:
Intermediate Graphic Design with Melissa Weiss
Illustrator, Sublime Text, p5
Fall 2020
Illustrator, Sublime Text, p5
Fall 2020
DOCUMENTATION IN PROGRESS
As the final project of Intermediate Graphic Design, we were to challenge the conventional notion of "maps" by creating graphics that would address some economic, social, or political issue of our choosing. The open-endedness of this prompt encouraged more individualized responses, and many resulting works were not geographical to any extent (including mine).
I found difficulty at first settling on an "issue" to depict, which can likely be attributed to a preoccupation with subverting traditional maps: so many of the infographics I was familiar at the time represented economic, social, and political information in the context of literal geographic locations. I believed it necessary to complete the design without the use of regular means, but I had trouble envisioning what form that would take. Eventually my general interests in sound and music led to a discussion with my colleague Alanna Tran, during which she pointed my attention to the struggles of the deaf and hard of hearing to enjoy the medium of audio.
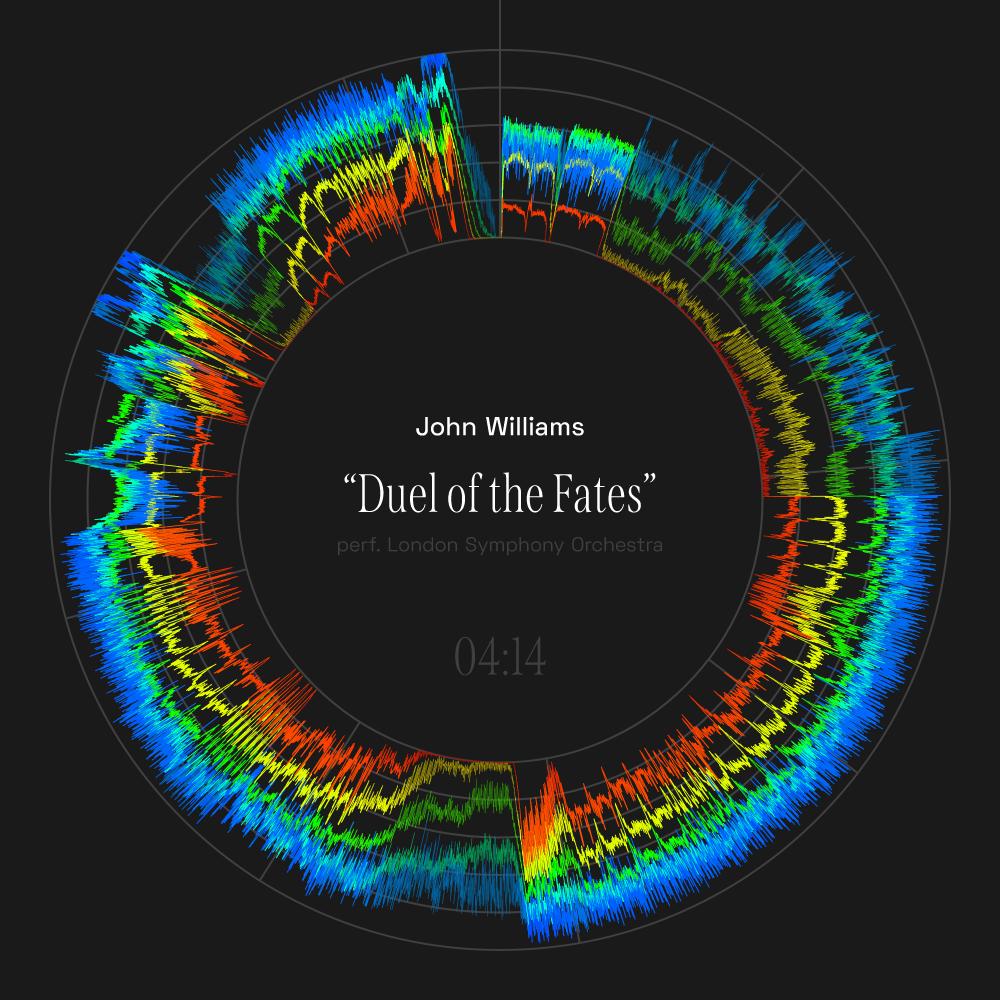
FIG. 1 Williams' "Duel of the Fates," performed by the London Symphony Orchestra, resulted in the most heterogeneous image of all the songs I rendered for the final critique. I had anticipated this from orchestra or concert band music because of the dramatic variations in volume and tempo often present in such genres.
At this point I really gained my footing on this project. My familiarity with conventional means of visualizing audio provided a great starting point for various explorations in which I attempted to combine variables including volume, tempo, and frequency into a single coherent system. These initially took the form of imprecise sketches on paper and later some more concrete concepts roughed out in Illustrator. Through a video Alanna sent me and my research that followed I learned that people who are hard of hearing are able to experience music through the tangible vibrations of low frequencies, so I decided this variable would be the most important to communicate.
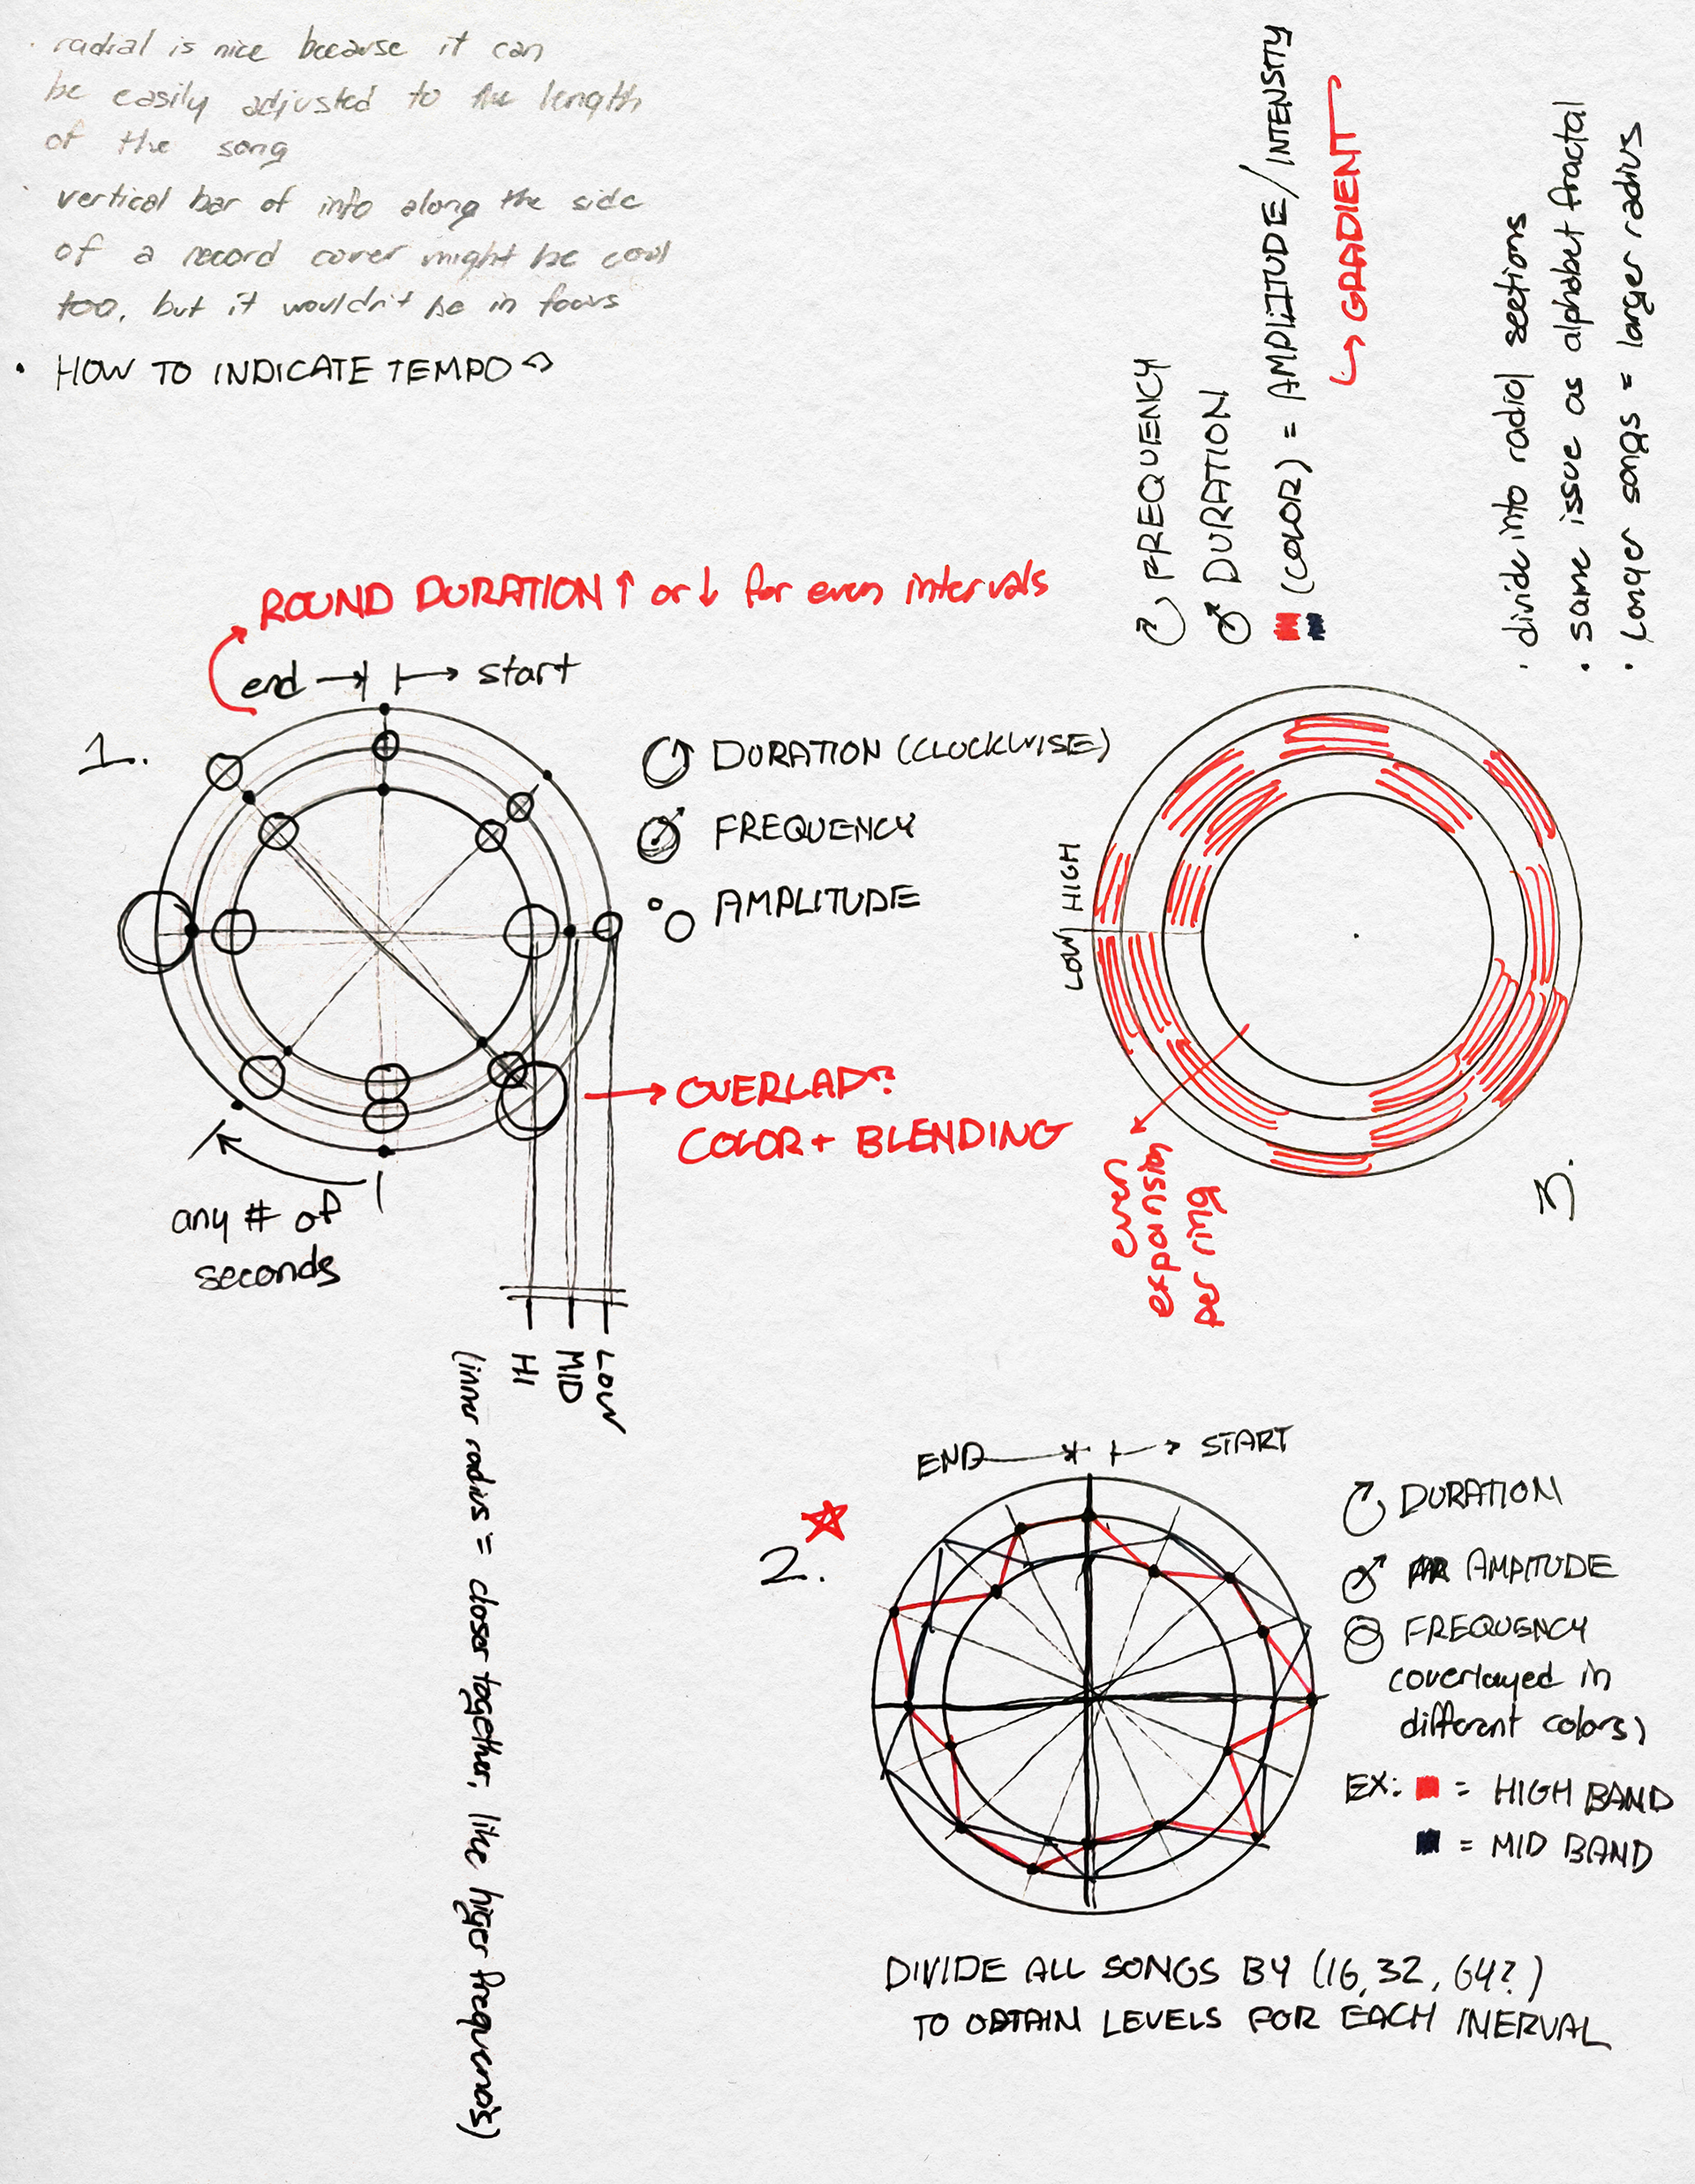
FIG. 2 One of three sketch pages completed in preparation for digital execution. At this point I had already settled on a circular format in which the circumference would communicate time, considering a linear format would result in long and uneven compositions.
Concept 2 (bottom right) is closest to the end result of this project.
With my ideas on paper and a clear direction to move forward, the following significant hurdle was actually collecting the data to visualize (including the aforementioned variables for the full duration of multiple songs).
In retrospect I have little idea what I hoped to accomplish by executing this process manually, and I very quickly realized that doing so was not only incredibly inefficient but also did not yield satisfactory results.
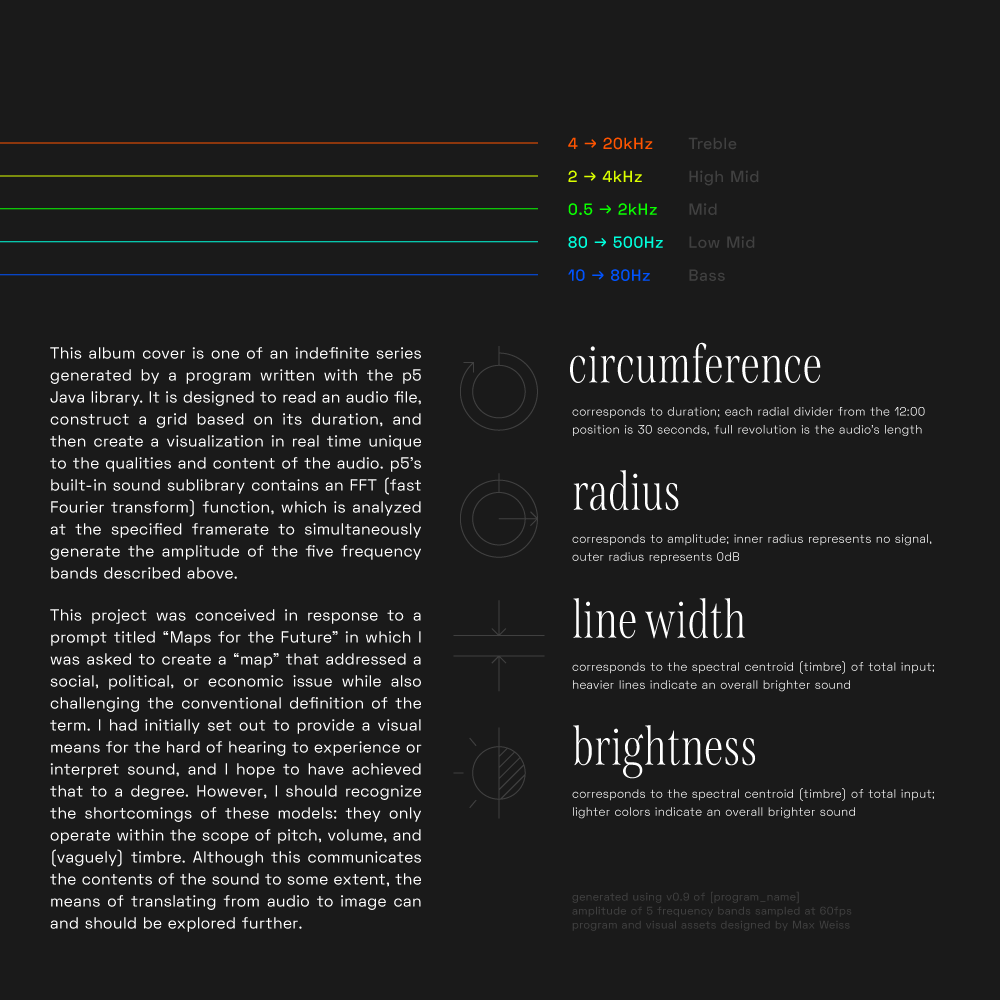
FIG.2 The backside of each album cover includes an explanation of the content on the front and a brief description of the project. In this state, all of the songs would share the same back cover.
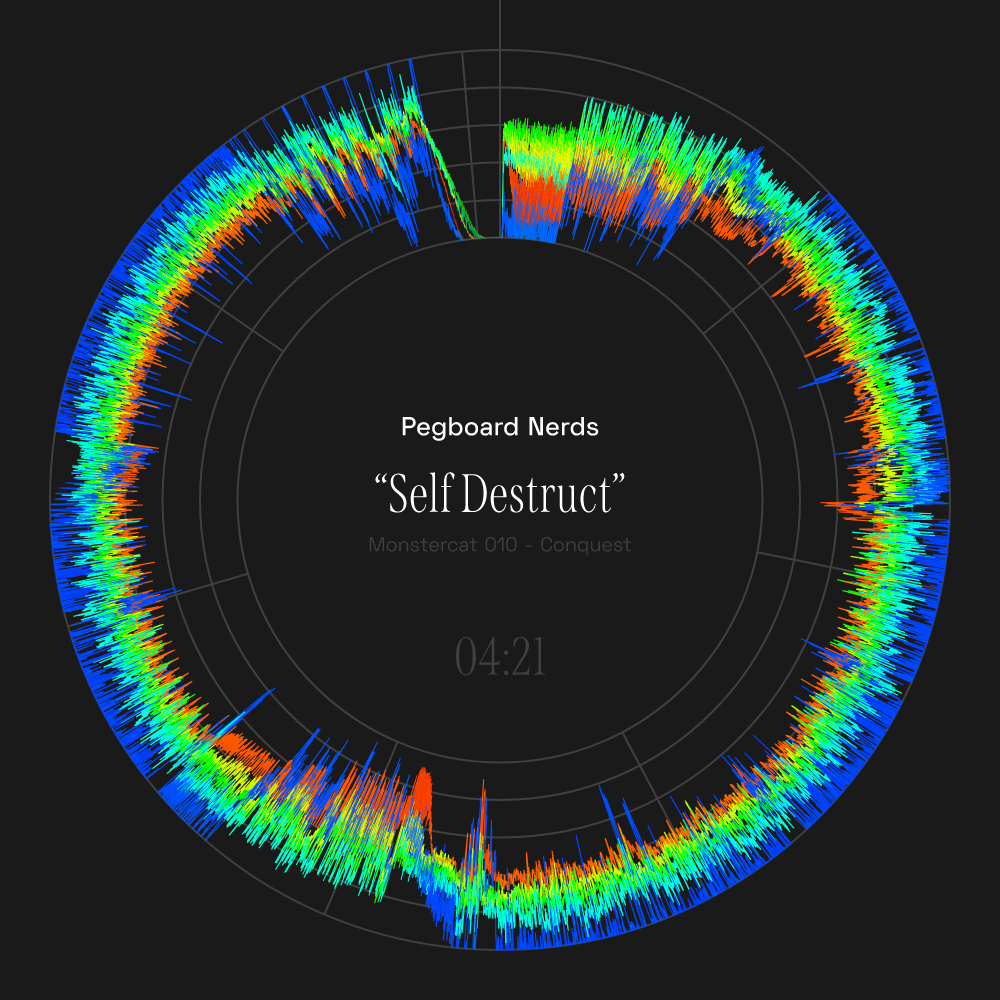
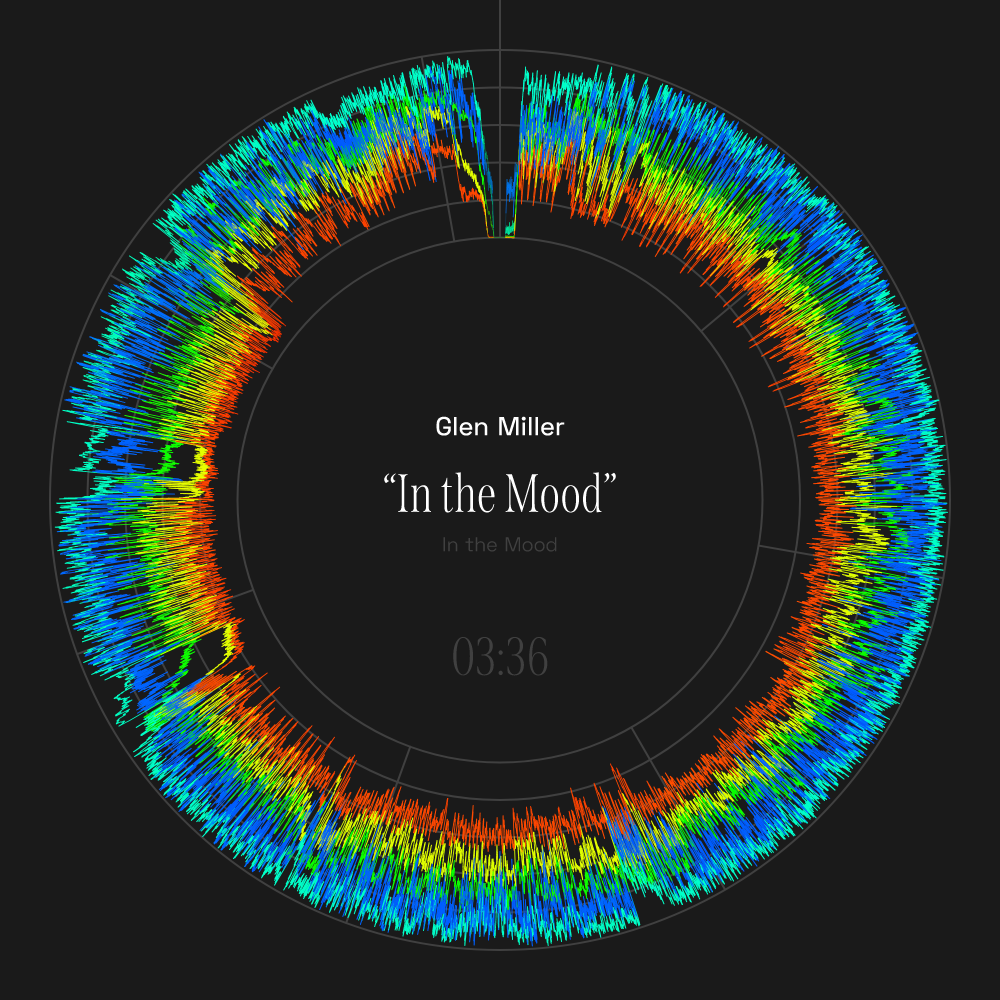
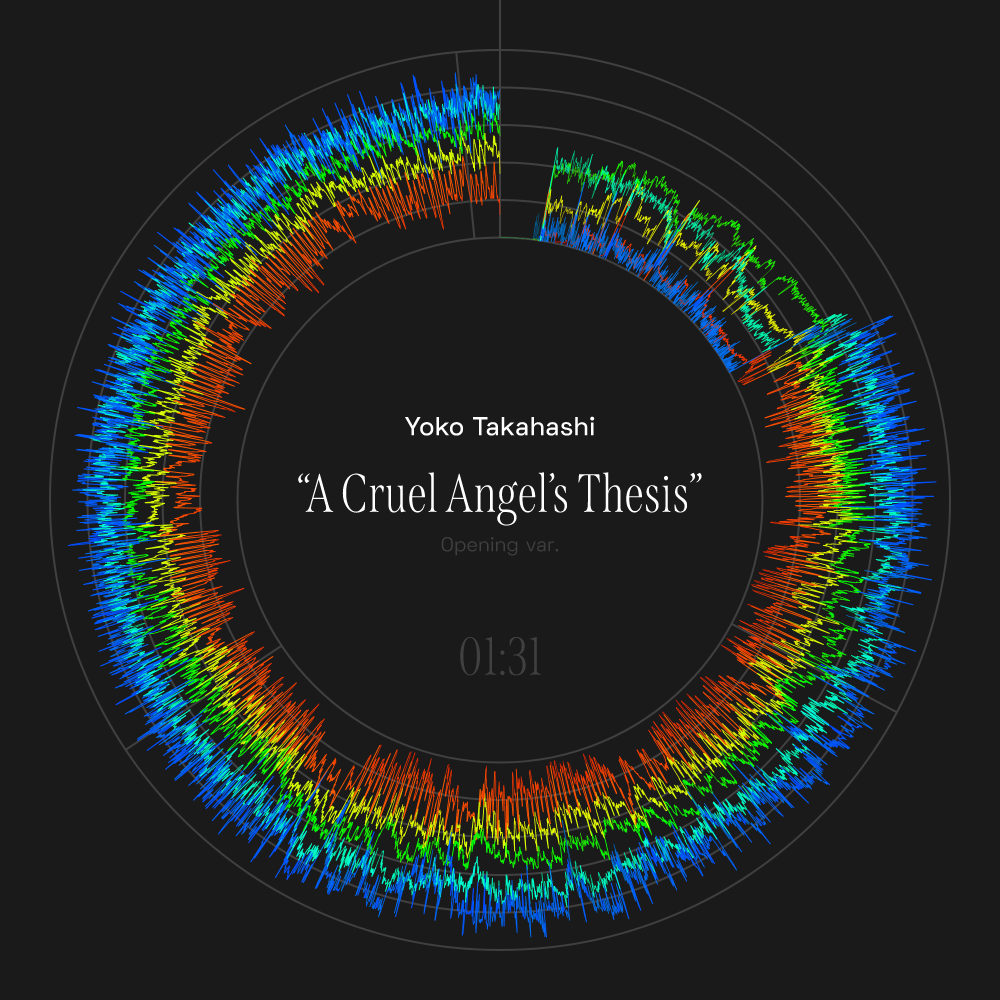
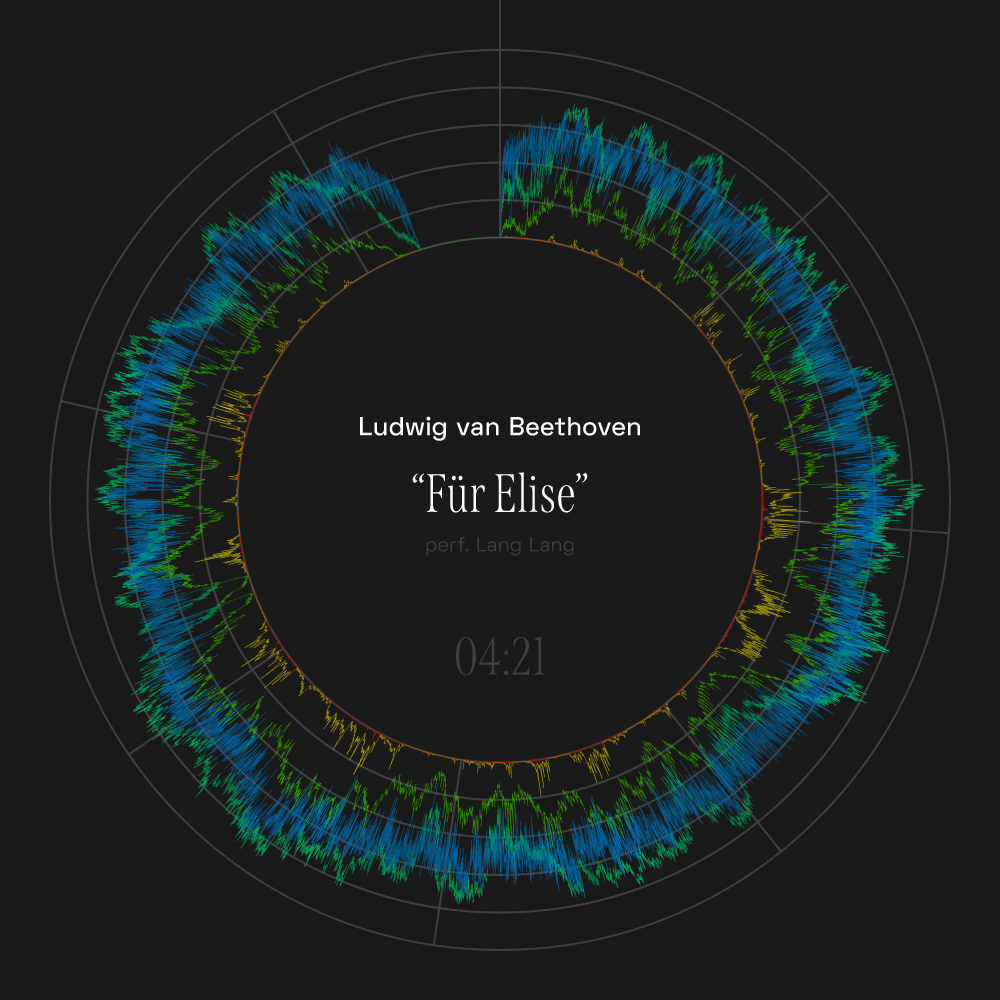
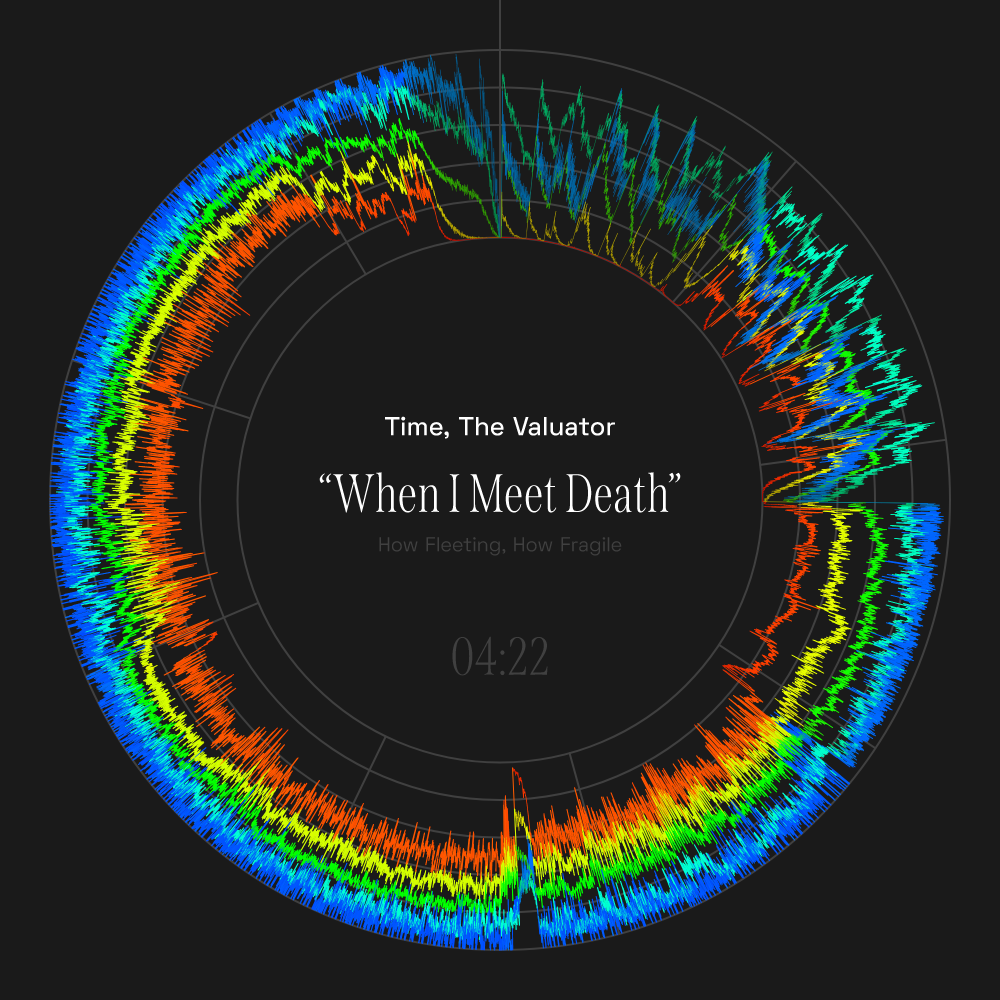
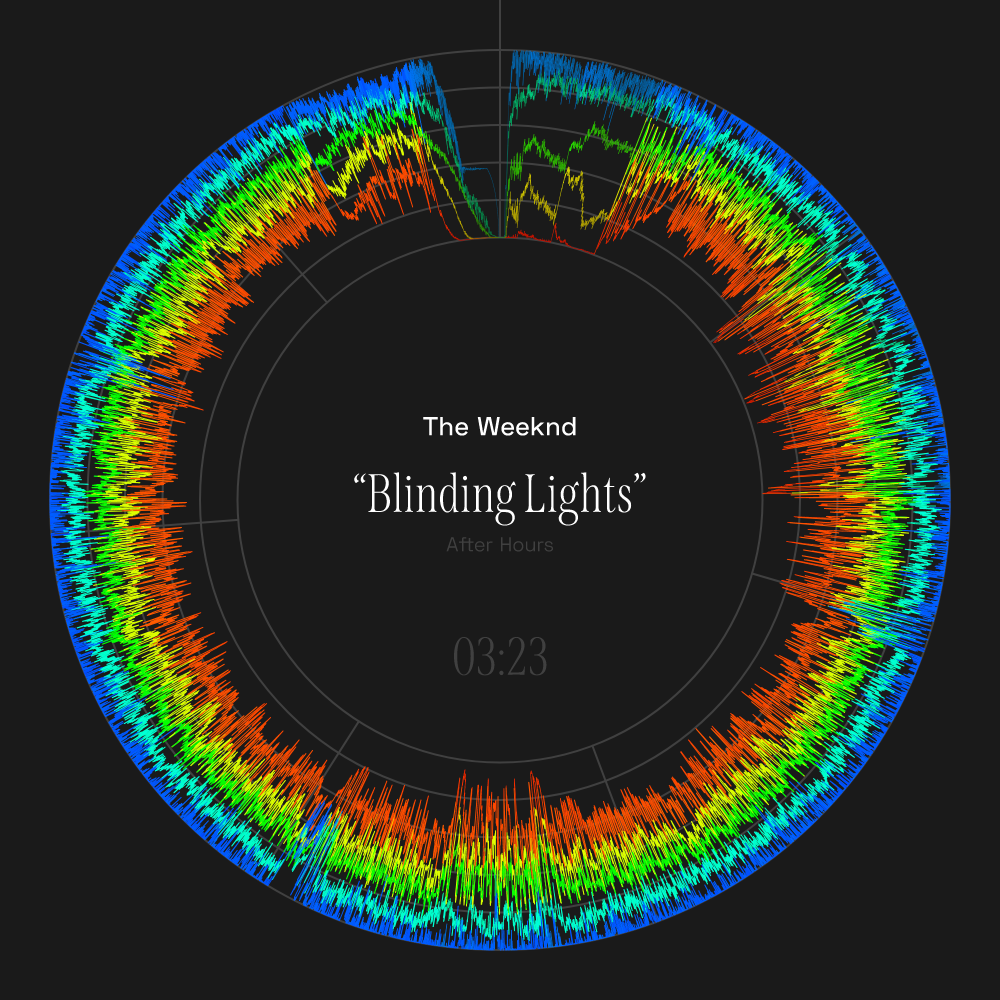
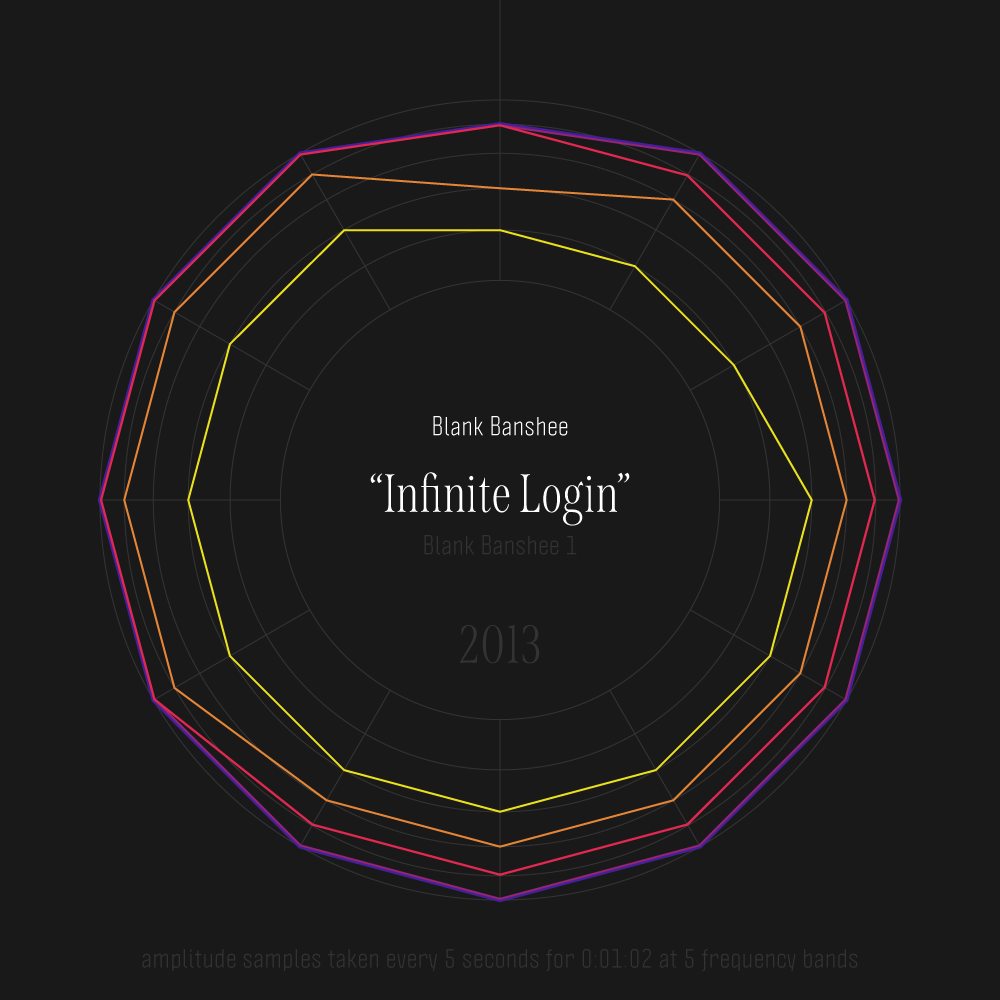
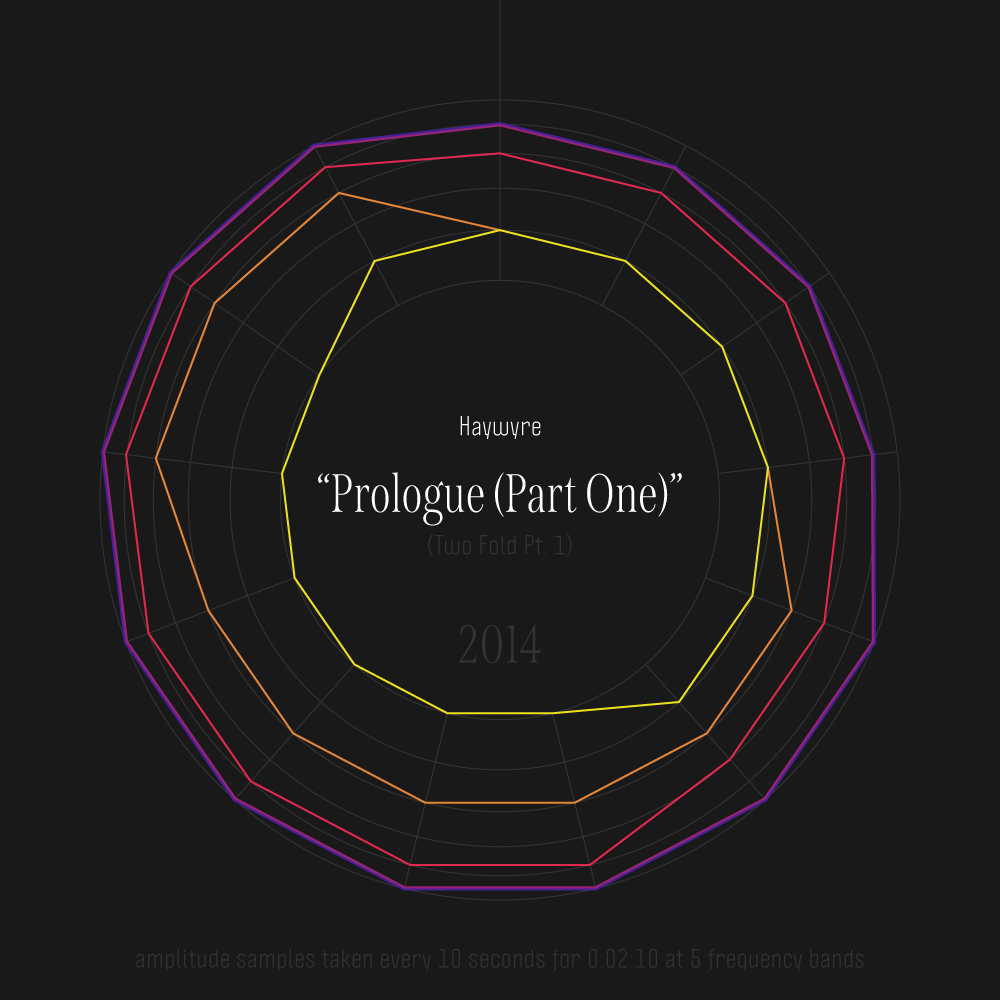
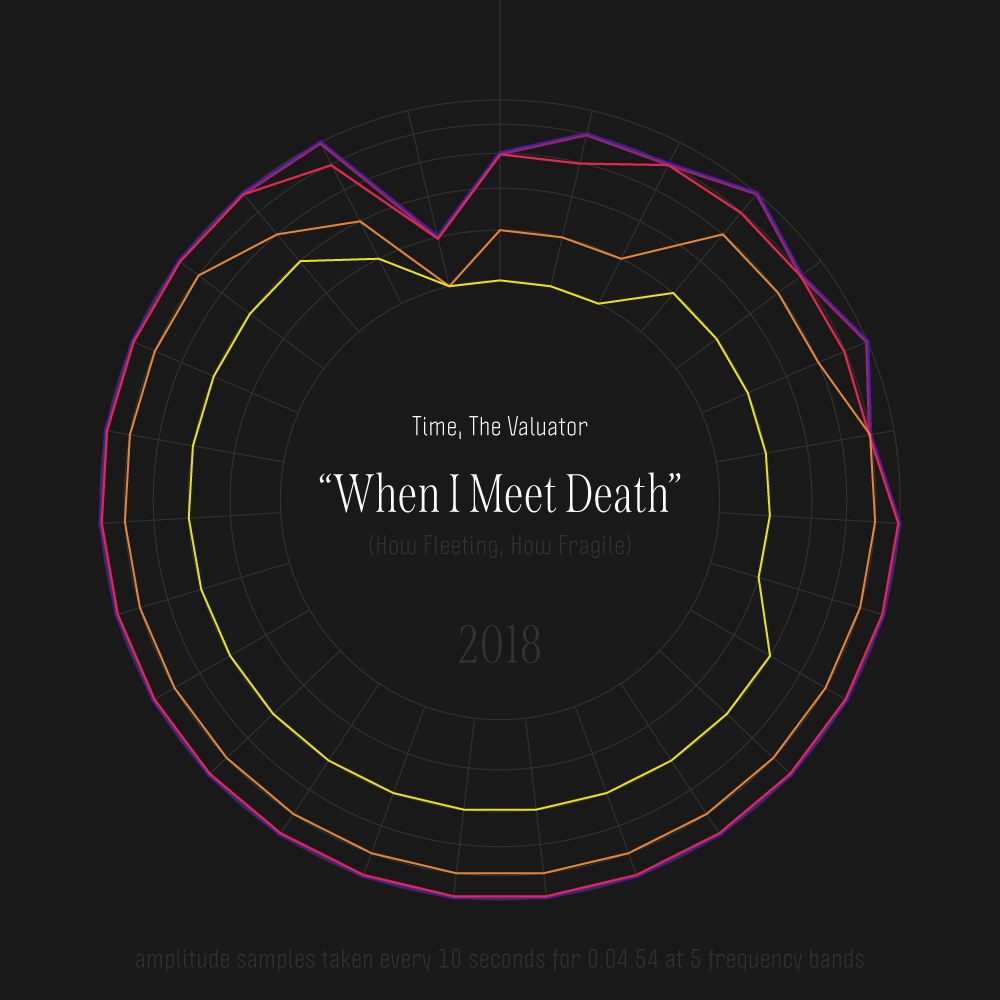
...represents the amplitude of five different frequency bands (the exact values of which are described on the back).
No, we're not related.